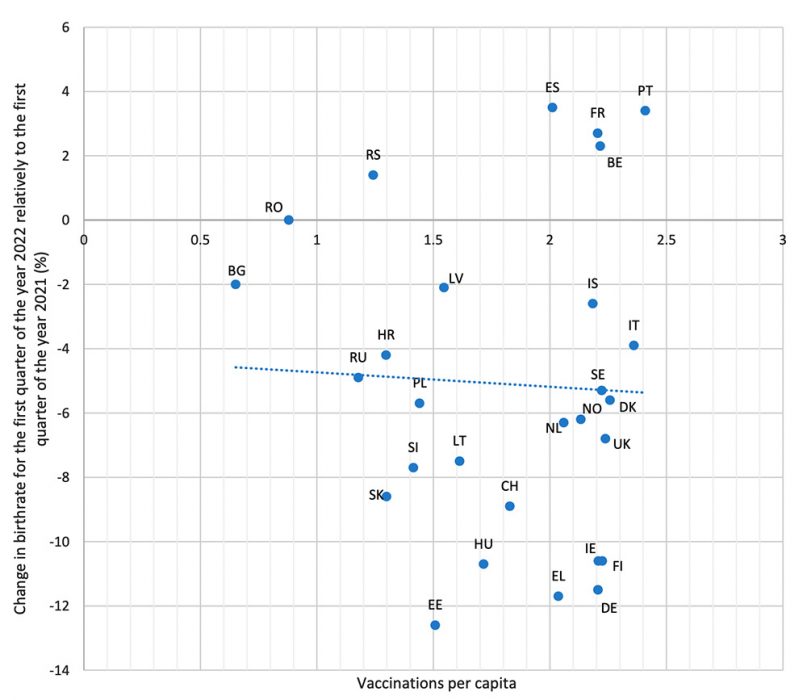
ANALYSIS. There is a very clear trend of an abnormal decrease in the birthrates in almost all European countries. The data shows that in countries with relatively low injection uptake the birthrate remained normal.
By Ingemar Ljungqvist, Dr. Sc, Dr. Glenn Dormer, MD, Husein Naser (Sweden)
In Europe most countries have reported a very unusual birthrate decrease during the first quarter of 2022, i.e. the number of live births. This occurrence applies not only to Sweden, there has been a reduction during the first three months of 2022 greater than 5%, compared to the previous three years.
Such a large change is very unusual and therefore requires an analysis of what is the cause.
Upon further investigation, one finds the information from SCB (Swedish Central Bureau) shows the birthrate decrease is not a one-time aberration, rather that this downward trend is continuing into the second quarter; April- June in 2022.
In the midst of a pandemic
We are still in the middle of a confusing ’plandemic’ – defined by WHO (World Health Organization) as a Covid-19 pandemic, where many measures (including so-called vaccines) have been implemented. It is therefore important to correlate these measures to the observed decreasing birthrate.
One of the many measures implemented during 2021 was mass-vaccinations which occurred in all European countries. On the other hand, uptake of the vaccines between countries has varied somewhat.

The number of injections is presented on the x-axis
Therefore, chosen as variables were for the X-axis the number of injections taken in the country divided by the number of inhabitants in each country.
A low example case is shown in Bulgaria, where the citizens took only 0.65 injections per inhabitant. The highest was in Portugal, where citizens took an average of 2.41 injections – of the 3-4 doses offered to the people.
Source: Statista.com
The change of babies born is represented on the y-axis
On the Y-axis is plotted the change occurring to birthrate – the total number of live births during the first quarter of 2022. In some countries, the data is given for the first four months.
The given birthrate then is divided by the corresponding birthrate from the first quarter (or four months) of the previous year – 2021.
In some of the cases, the average birthrate was taken from a small sample from the previous years. This numerical calculation gives the percent rise or fall of birthrate; Source: www.rokfin.com/post/91372.
The countries are plotted on the graph. Of the countries with a large population, the data for Austria and the Czech Republic is missing.
RESULTS
The graph shows a very clear trend of an abnormal decrease of the birthrate in almost all European countries.
The trend is evident for the first quarter of 2022 which corresponds to the quarter where nine months have elapsed since the first C-19 injection was given. In countries without major pandemic measures, the birth rates are relatively stable.
Certainly, there are seasonal differences in the monthly number of births, but the same time frame was used for the same period 2021, so this factor is negligible.
A normal variation between years is +/- 3 %. In the case of a greater variation, the difference should have a plausible explanation.
In the graph, there are seven European countries that stand out. Three of them are in the left part of the graph; Bulgaria, Romania, and Serbia – but in each of these three countries the vaccination uptake was low.
Also, the data shows that in countries with relatively low injection uptake the birthrate remained normal.
There are also four countries with high vaccine uptake i.e. greater than 2 injections per inhabitant, as shown in the graphs upper right portion. They are Belgium, France, Portugal, and Spain. In these four countries, the study should be followed up since they go against the general pattern.
Concerning Spain, there are clear indications that the birthrate declined radically – but it was first observed in the month of April. In this case, even Spain is following the general pattern.
The pattern in this simple study is that there is a correlation between vaccination uptake and declining birthrate.
The blue line in the graph is a so-called trend line, which is generated by the computer and shows the correlation.
The decrease in Birthrates in Europe needs discussion
This analysis can also lead to a broader study of the world’s other countries, providing there is access to reliable statistics.
It would also be interesting to investigate if the so-called vaccines themselves show any difference, meaning if there is any difference in birthrate within countries using traditional vaccines compared to mRNA injections.
Certainly it is important to replicate this study at the mid-year point, in order to summarize the results.
It should be clear at this point that the birthrate declines more the longer the vaccination effect continues. If the decline in birthrate is only a short aberration, then the data should normalize.
In addition to this study, at least in Sweden’s case, should occur a reliable analysis of the health status of the children being born. Several licensed, reliable, verbal sources have reported many more spontaneous abortions (after the vaccines were implemented). Additionally, Cesarian section births have increased, because of the worsening health status of the child in utero.
This study also gives strong support to independent researchers such as Ann-
Chatrin Engwall and Judy Mikovits, who long before the so-called vaccines were implemented, strongly warned against their use in pregnant women.
By Ingemar Ljungqvist, Dr. Sc, Dr. Glenn Dormer, MD, Husein Naser (Sweden)
Related
- Nytt ljus över vacciner [New light on vaccines], AlmaNova.eu number 3, 2022
- NewsVoice, news in English

